IVMission
- Author
- Leonardo Pinero-Perez
- Written
- 2018 · Report, University of Texas at Arlington
- Original
- Full report · 120 pages
- Contents
- Nomenclature · Chapter I · II · III · IV · V · VI · VII · VIII · IX · X · XI · Appendix · References
- Ref
- MAE 4351-2018
Converted from the original PDF on with Claude Opus 5.5. The wording is unchanged, except: two classmates’ names are replaced by their roles, Figure 54 (an attendance sheet) is omitted, and my name is spelled without accents. Equations, figures and numbering follow the original. Conversion not yet checked against the PDF.
AKey Mission Design Parameters
In Dale Reed’s Lifting Body history book, the cross-range advantages of different re-entry vehicles (with different aerodynamic properties such as lift-to-drag ratio and slenderness) are shown to reveal the “race-horses” of lifting bodies. There is an obvious strong positive correlation. This relationship is analogous to the lift-to-drag ratio found in the atmospheric Breguet Range equation. However, the range is greatly increased and more sensitive to lift-to-drag ratios when the trajectory is combined with orbital velocities, where the curvature of the Earth reduces the lift required to stay afloat.
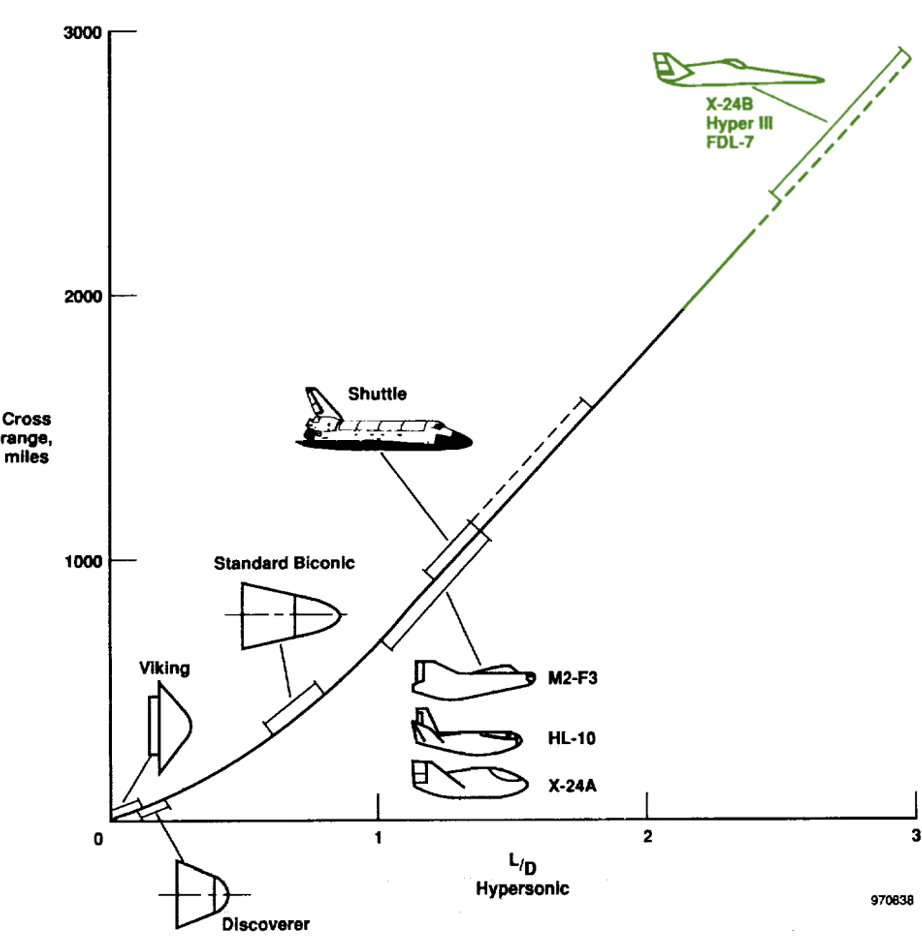
This correlation can be found to be defined as a function of cross-range in the Spacecraft Propulsion Integration book [2]:
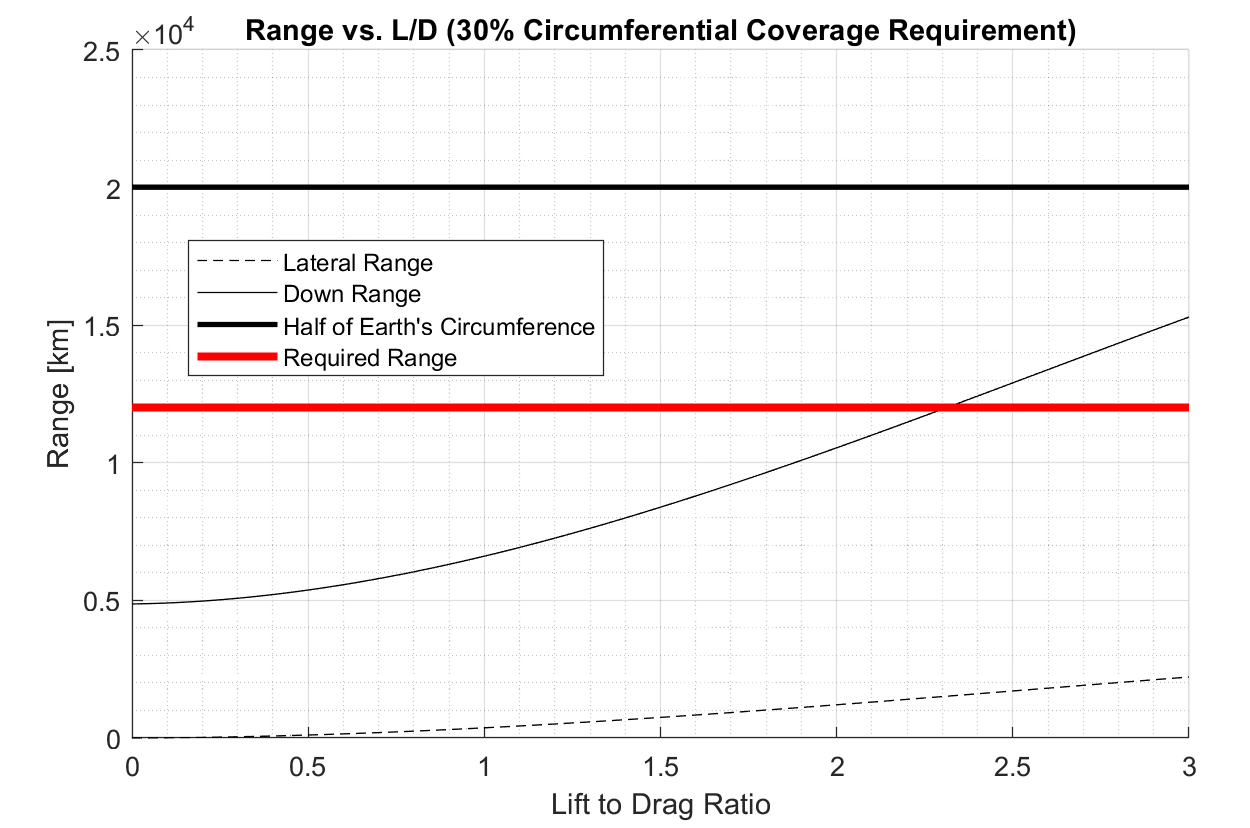
These equations found in ref. [2] are plotted in the design script. It is useful to compare this plot with the figure above to find the region for which these trend equations are valid. This comparison script can be expanded to calculate the required lift-to-drag for a given down-range coverage percentage. Below is a plot of the lift-to-drag that a 30% circumferential coverage would require.
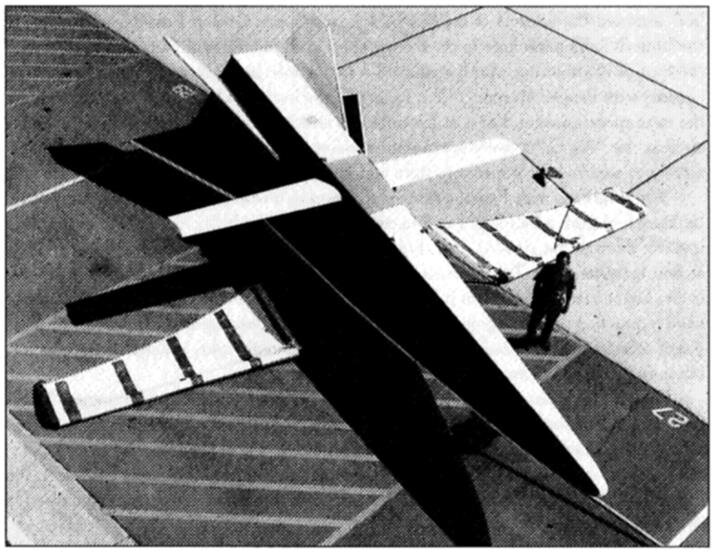
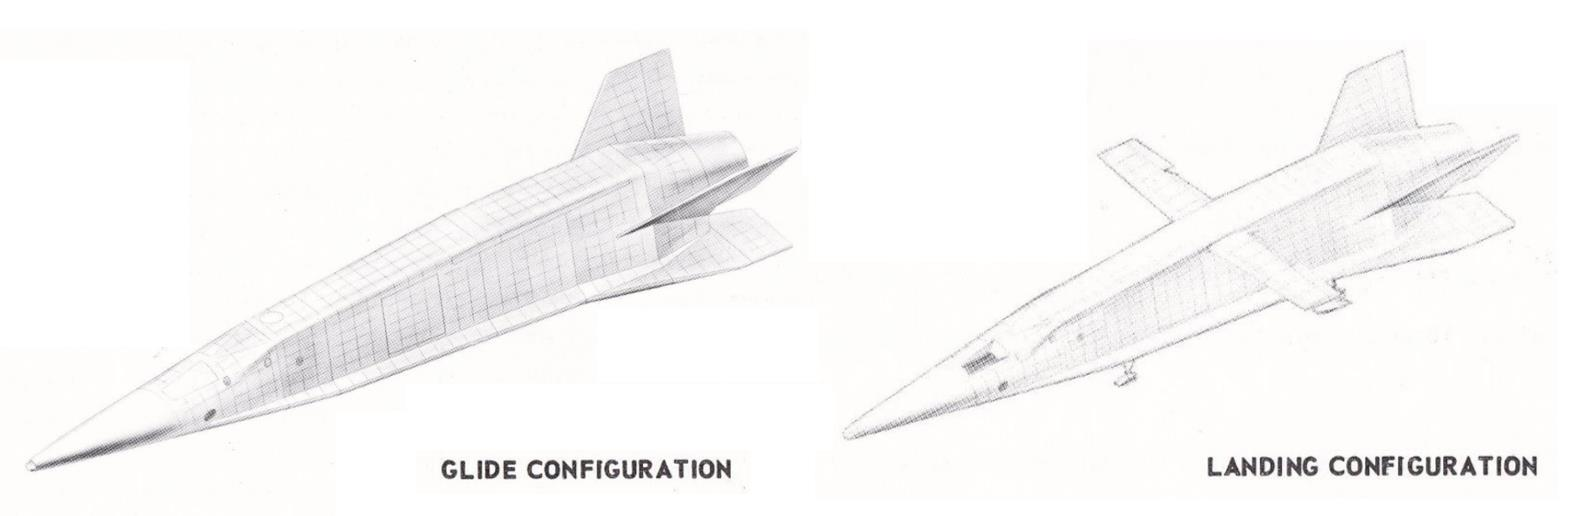
While these lift-to-drag characteristics are exhibited in hypersonic flight, the aircraft still needs a different geometry which provides a low-enough wing-loading for safe runway landing. A demonstrator is shown below [27]. This vehicle was unpiloted and is different from the Model 176 in its deployment method. This can be a good trade study for systems, structures, and aerodynamics. There must be a design choice between switch blade wings and single piece pivot wings.
One of the main historical sources for this design project is the Model 176. Many declassified specifications make the initial weights and geometries known. This allows the launch and hypersonic vehicle teams to work independently. The starting document also gives the missions the vehicle was designed for. The reconnaissance mission is considered the design-critical mission from which the two other mission alternatives can be built upon. In this way, the same design can be minimally reconfigured to fit multiple roles in military operations. A section of the project introduction document is shown below, with the reconnaissance portion outlined in red. The first methodology will be built around accomplishing this mission.
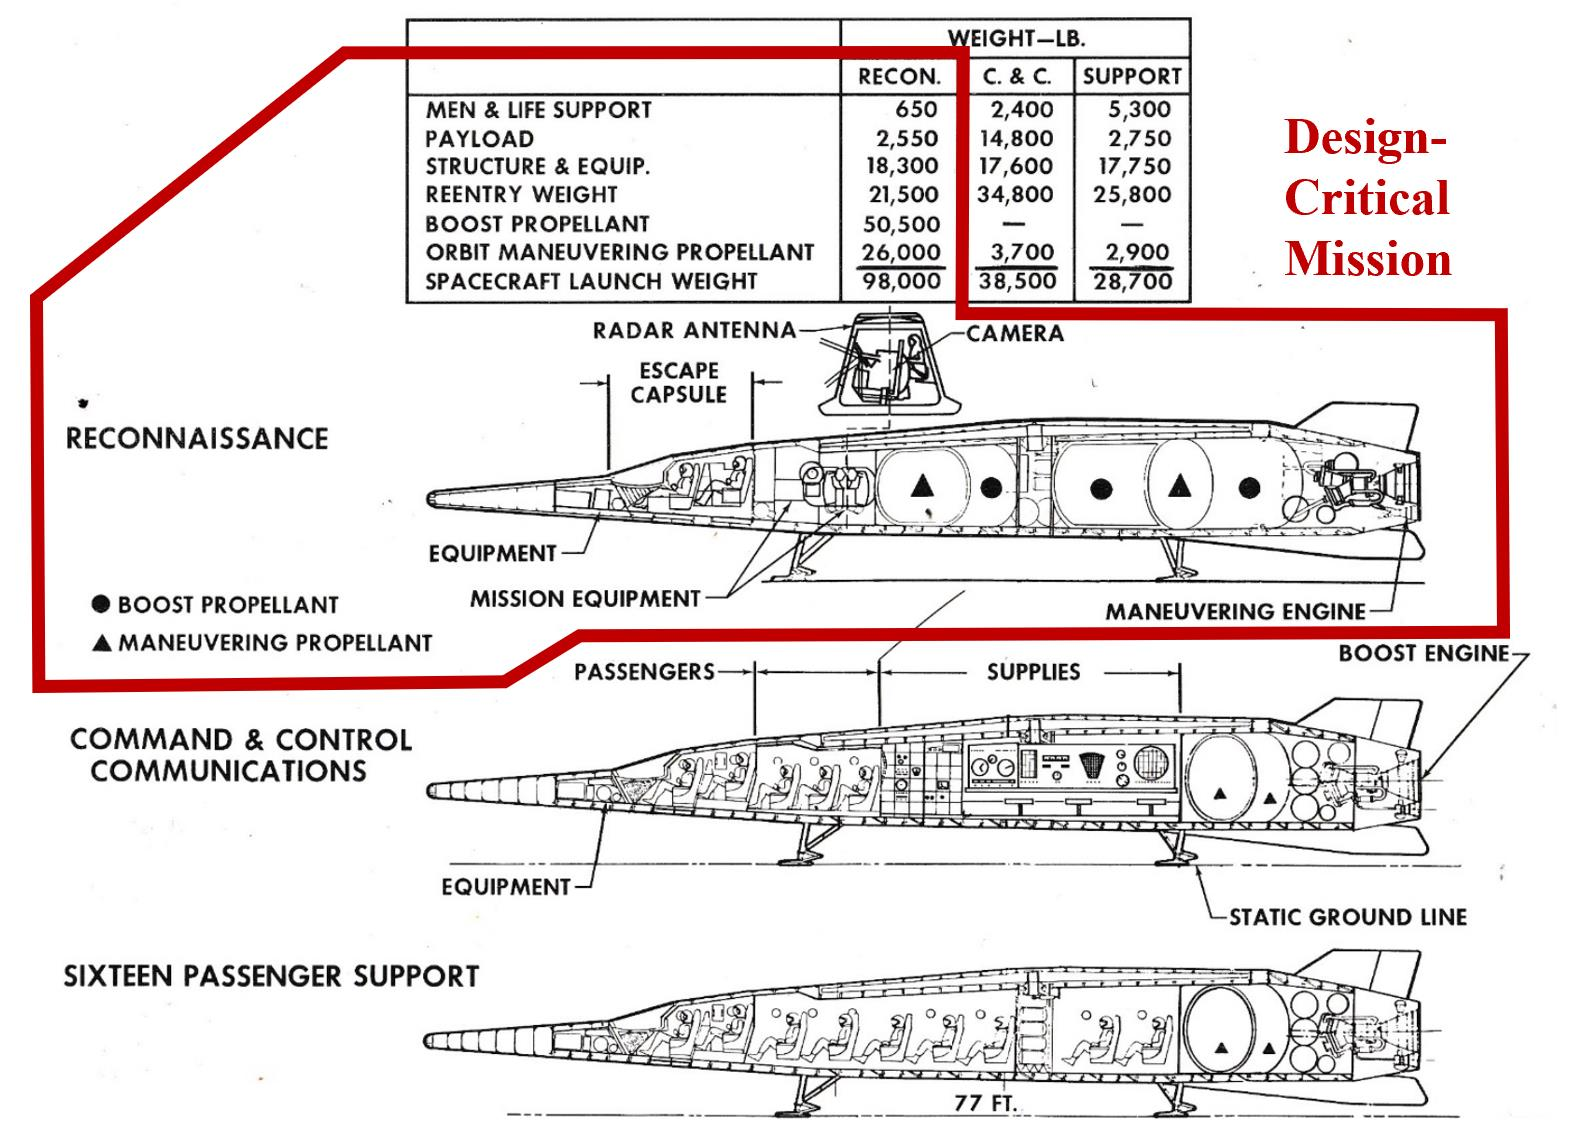
The model 176 had two in-flight configurations, featuring a switchblade wing to decrease wing-loading to allow for slower, safer landing speeds. An objective of aerodynamics will now be to determine the necessity of such a device and explain why the vehicle would have failed mission requirements without it.
BPoint-to-Point Transport
The point-to-point variant will be the most common layout, as it will support the civilian market. The layout, as shown in the previous section, includes 16 passenger seats. This variant is the lightest of the three, and rightly so, as these missions will generate the least revenue in lower ticket prices to capture as much of the market as possible.
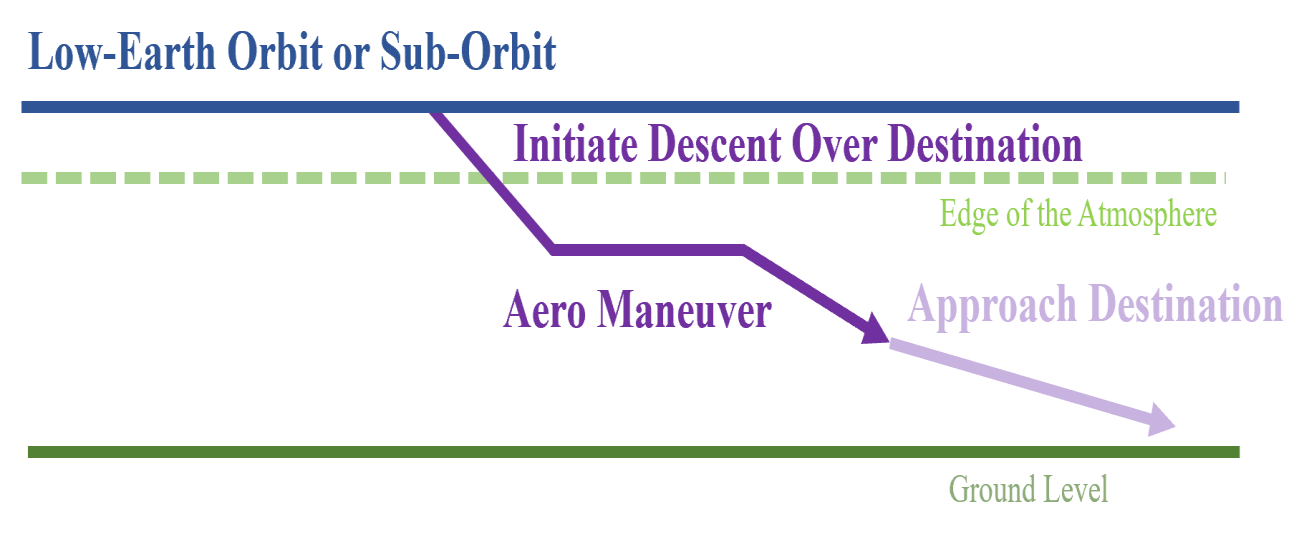
During descent, the vehicle may initiate an aerodynamic maneuver to increase its lateral ground-track. Doing this will allow the craft access to more airports outside of its direct orbital path. Much of the purpose of the point-to-point mission was described in the business case, where the main idea is to have as much access to as many destinations as possible to create the demand to support a sustained flight rate, lowering costs. These lowered costs allow for greater flight rate, and so on and so forth. This translates into a mission parameter in the sense that the craft must have a large cross-range and lateral range, which is dependent on aerodynamic characteristics (see previous section in this chapter).
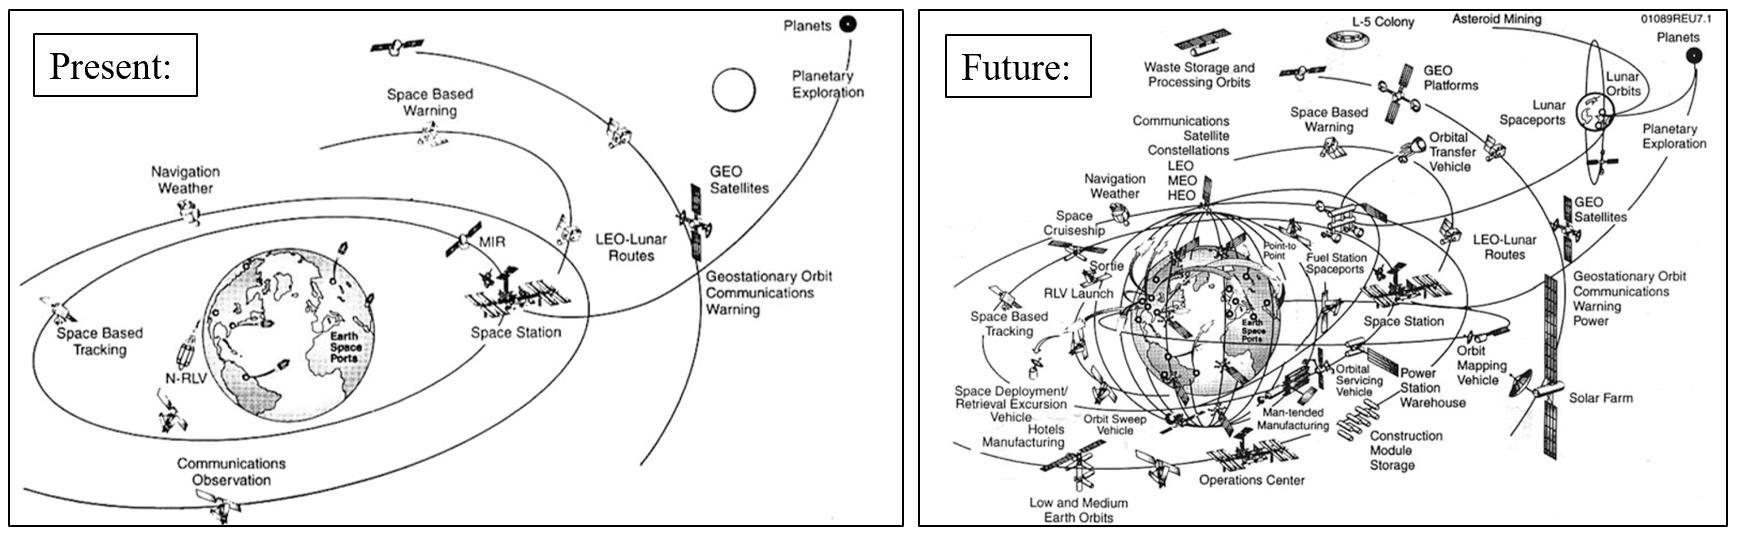
Additionally, the sustained flight rate is made cheaper by reducing the number of vehicles in the fleet. Keeping the fleet size at 50 (as described in the business case) requires a turn-around time. In this sense, this vehicle has a special economic advantage because of its reusability and rapid turn-around time. A comparison of current space-launch operations with what they could be by reducing payload costs is shown below. This is the predicted market-change result from an increased flight-frequency by increasing cross-range capability [2].
The effects of cross-range capability on orbital wait time are shown below. For a given inclination, the runway must be perfectly aligned with the orbital path if there is bad cross-range capability. A reduction in wait time greatly reduces operational costs. If a vehicle could go in and out and be rapidly recovered, the logistical and business benefits to run such an operation are obvious.
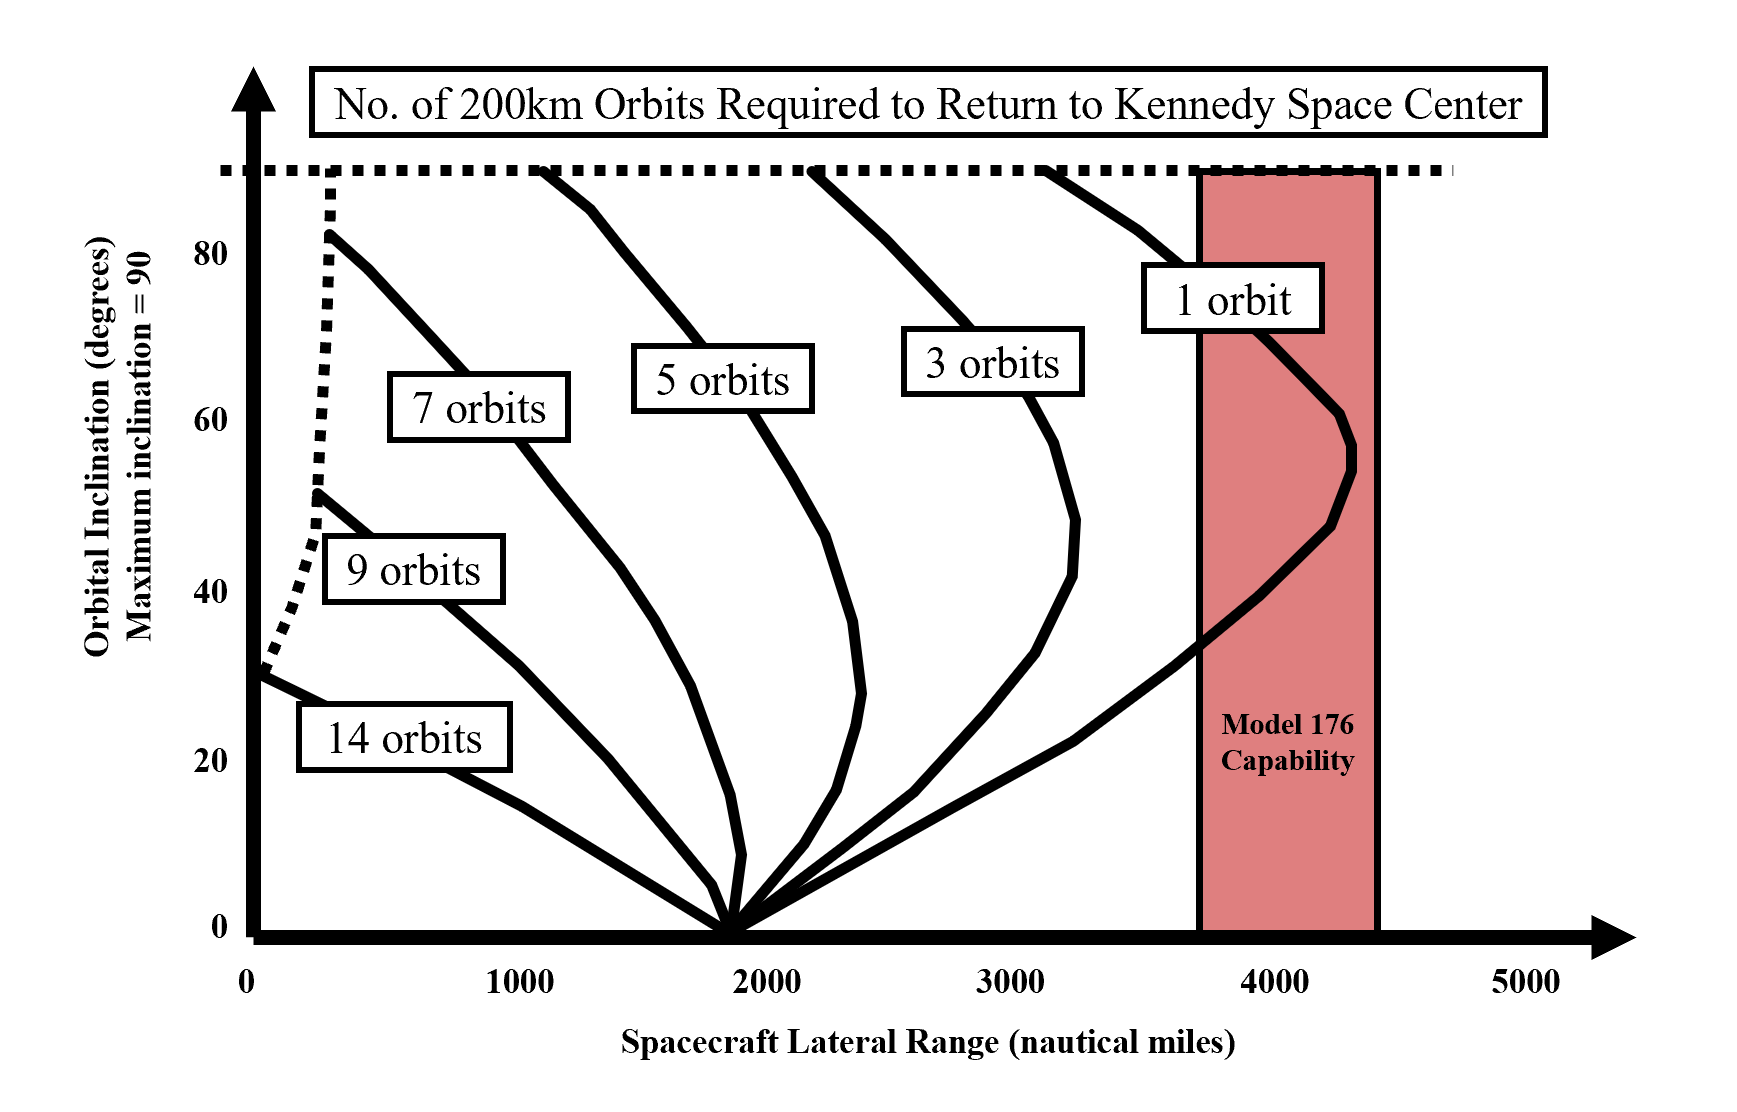
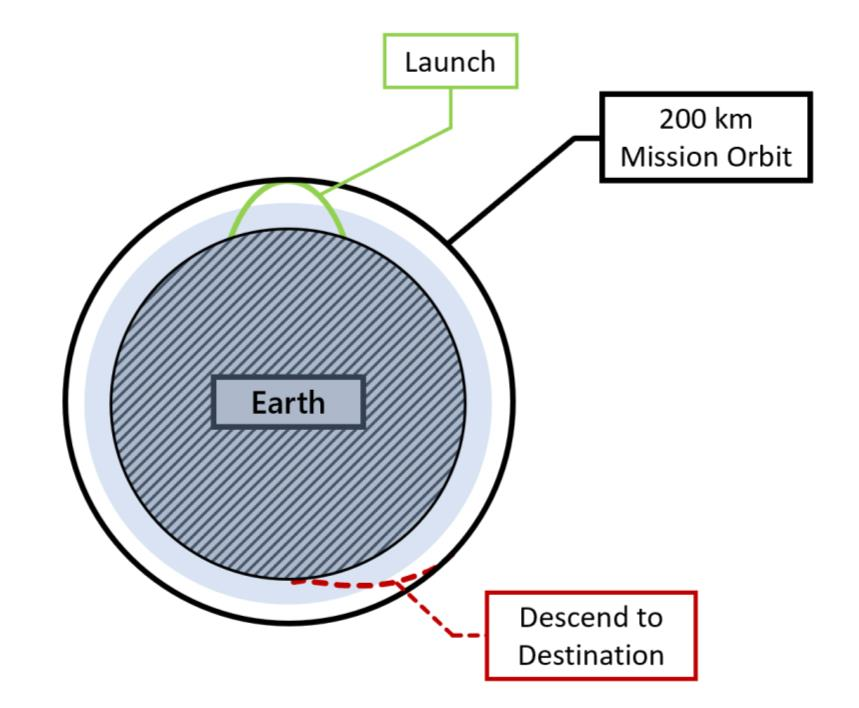
The Model 176 has a lateral range capability which allows for a turn-around time within the orbit. This is required if the vehicle will be ready the next day. The overall mission profile of the point-to-point variant is shown in Figure 36. This profile can provide access to low-earth orbit as well as one-way global coverage of destinations.
CCommand and Control
The Command-and-Control variant is an orbit-capable craft designed to conduct military operations independently in space. This can include satellite repair, bringing supplies and equipment to orbit, or coordinating space activities with human presence in low-Earth orbit. Whatever the operation may be, this variant is designed with a higher payload capability for life-support to sustain up to 5 astronauts. Additionally, the craft retains the capability to land safely on continental U.S. soil at any time.
The life support requirements for this variant are found below. In the weight equation, “lifesupport()” is a MATLAB function (found in the appendix) developed by the author and CAD team to determine the amount of food, water, and air a crew will need for a given mission duration. This was found in Corning’s Aerospace Vehicle Design book [12].
A simplified diagram of the mission profile is shown below. If the fact that this variant is designed for a week of operation with extra payload is ignored, this is profile is similar to the other two minus their respective added capabilities.
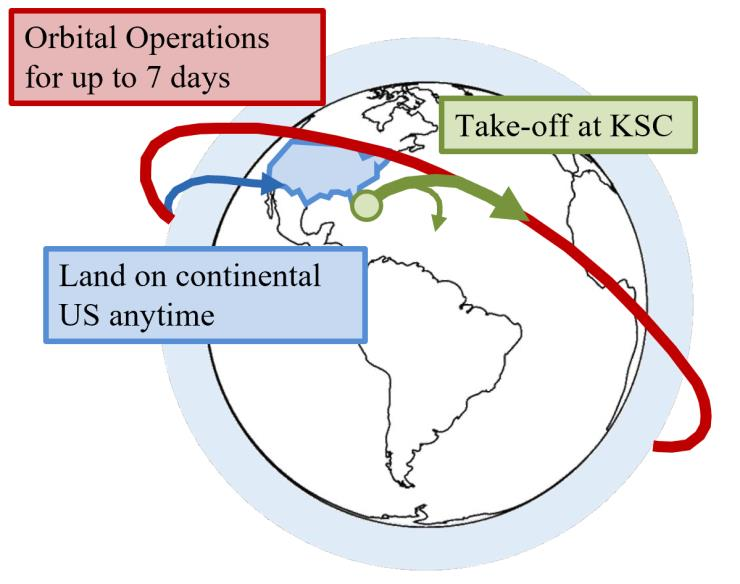
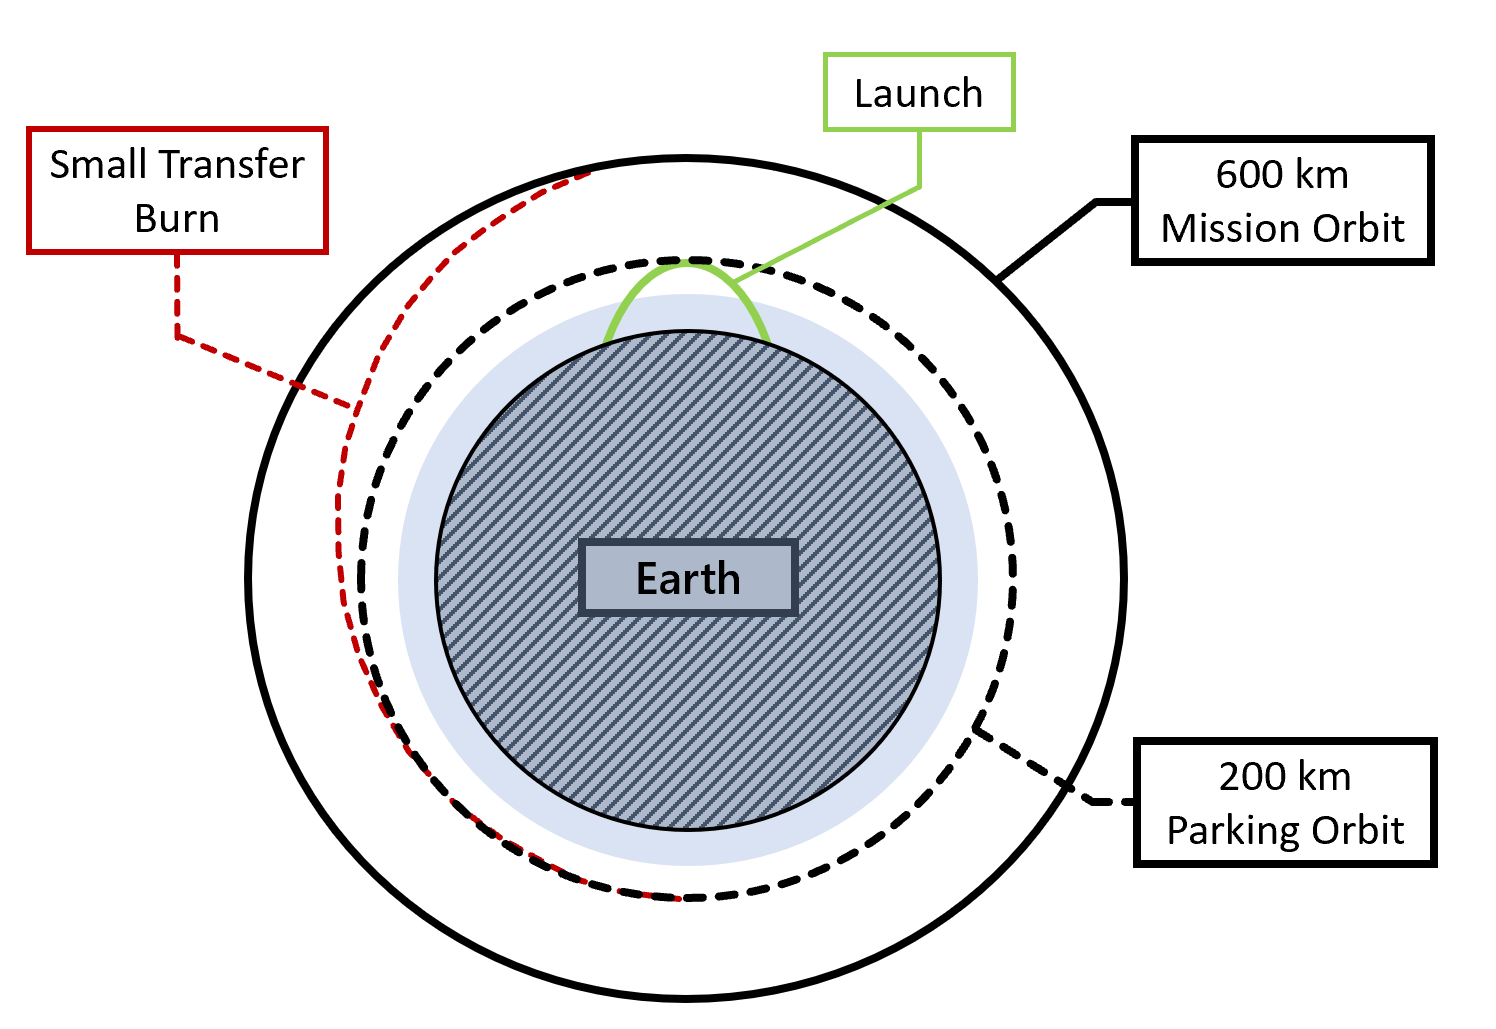
The overall mission profile for the command and control variant is shown in Figure 38. This represents a need to maintain a 600 km orbit to reduce the ground-track velocity. The spacecraft will inject into a 200 km orbit as a requirement for the launch vehicle. From here, the orbital propulsion capabilities of the Model 176 will conduct a Hohmann transfer to achieve the desired orbit altitude. This altitude will be maintained for up to a week according to life support requirements, where, as demonstrated by Figure 37, the spacecraft must be capable of landing in the continental United States at any point in time. This capability is determined by the lateral range, as shown in Figure 35.
DReconnaissance
The design-critical mission takes advantage of the lifting qualities of a hypersonic lifting body in another way. The orbiting stage can use its engine to descend into the atmosphere and make a turn by using the lift to perturb the orbit so that it can change inclination. This new orbit allows for the surprise reconnaissance of any location on earth while using minimal fuel for a trajectory change. The only fuel required is used to decelerate to descend into the upper atmosphere and then to increase speed back to orbital velocity. Minor orbital maneuvering can be used to alter inclination slightly or rendezvous with another body in Low-earth Orbit (LEO). A diagram of this maneuver is shown below.
By adding this maneuver, the reconnaissance variant experiences the design-critical mission profile which is most demanding on the vehicle sizing in terms of fuel and volume required. The mission profile for the upper stage can be summarized by the figure below.
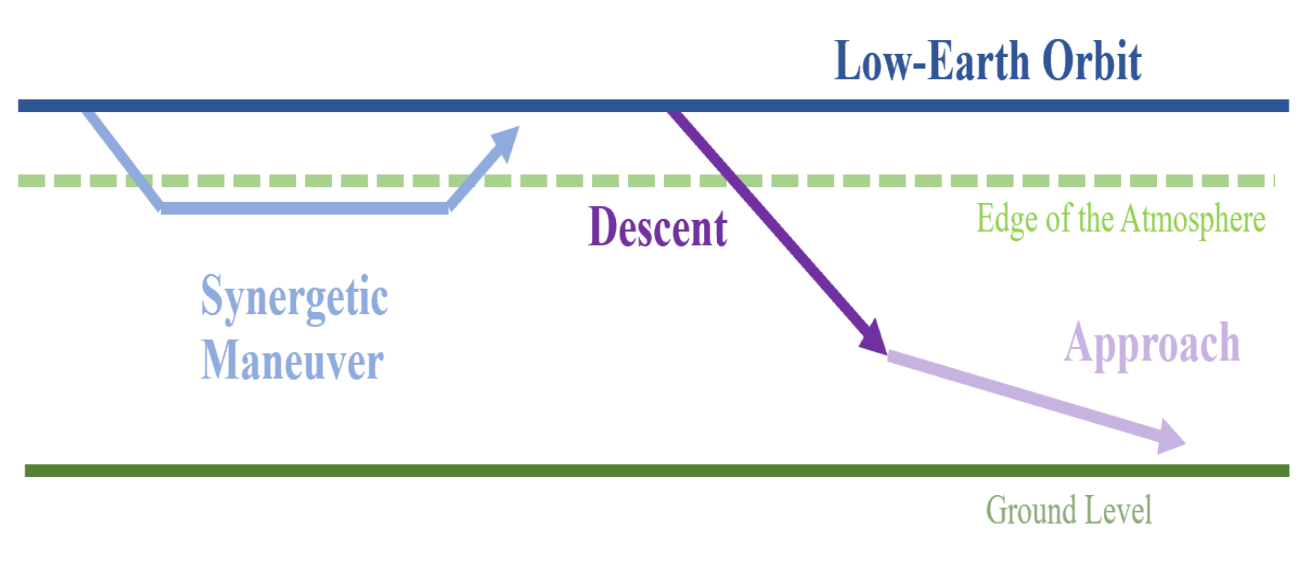
The maneuver requires three burns (calculated as four velocity increments): descent, boost, and re-circularization. The descent and re-circularization should be the same velocity increment if the initial and final orbit differ only by inclination. The boost burn is calculated as two velocity increments: one will add the velocity lost during the maneuver (function of lift-to-drag ratio) and the other is the increment required to accelerate back up to the new orbit. Vehicle parameters such as the lift coefficient, weight, and lift-to-drag determine the altitude of turn, the length of turn, and the achievable inclination change with a given delta V for a vehicle are determined inside a NASA report detailing Nyland’s analytical methods [28].
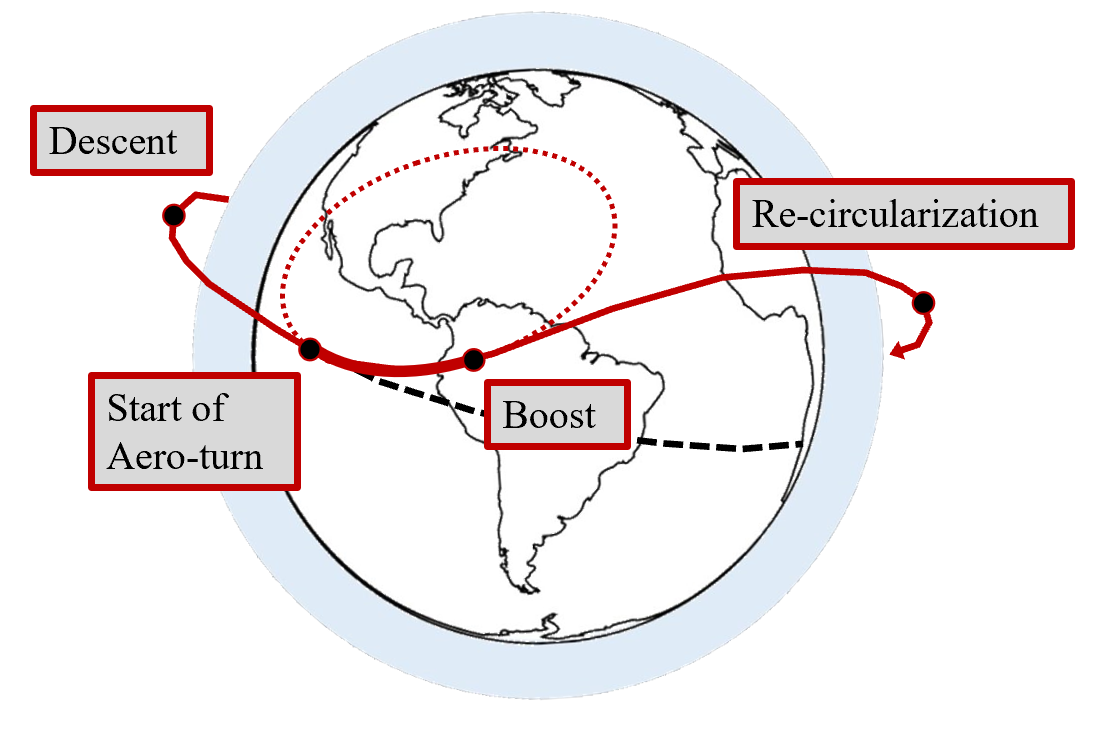
The combination of this upper stage with the launch system provides the full mission profile. There is a delta V requirement at launch to insert itself into orbit, as the historical Titan III launch system was not able to carry the upper stage. This is the heaviest variant, since it needs to carry fuel for the burns shown in the figure above.
Synthesis has laid out a diagram of the critical mission combined with the launch vehicle below [29].
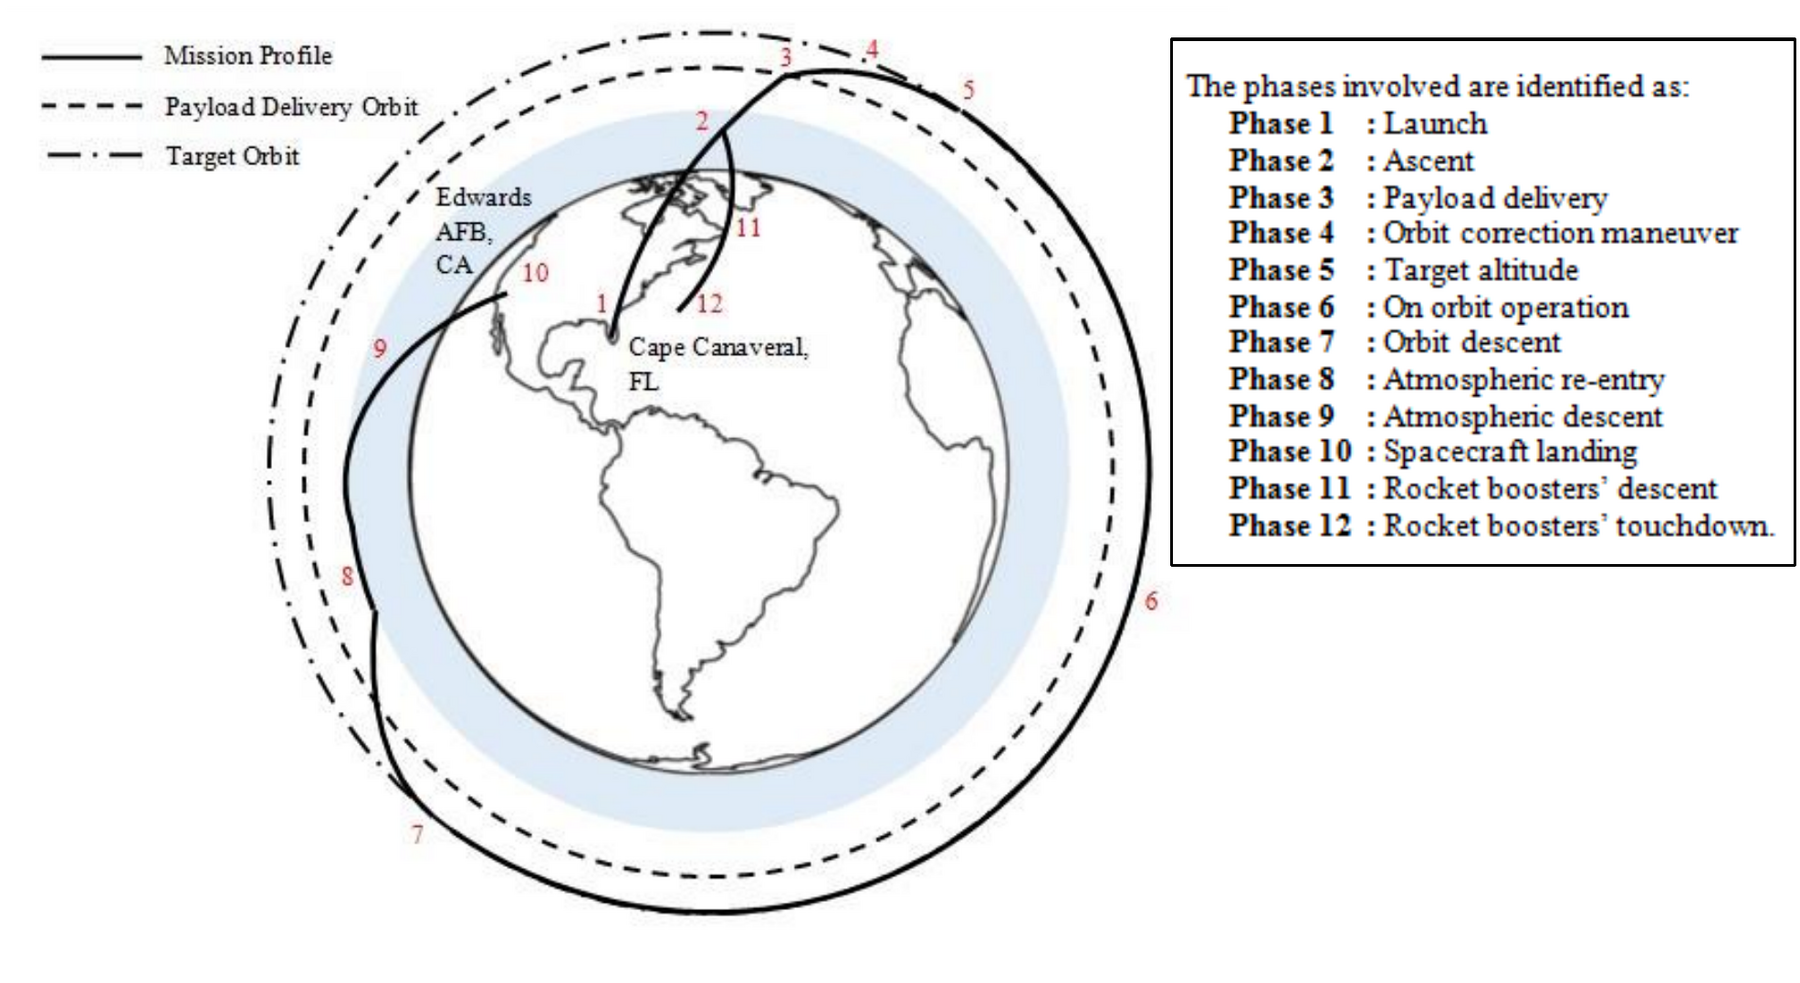
In order to ensure full Russian coverage at an inclination of 70 degrees, it was determined that the launch vehicle should place the hypersonic vehicle at an inclination of 40 degrees. At this low inclination parking orbit, the hypersonic vehicle cannot be easily seen. When it is time to begin the reconnaissance pass, the hypersonic vehicle is required to complete a 30-degree inclination change by means of aerodynamic maneuvering.
The number of crew required for such an operation is three. For a vehicle to remain in orbit for three days, the volume of the payload can be defined by a trendline from various studies on human tolerances [31]:
The number of crew members for a given mission time will also affect the amount of life support carried. The CAD discipline wrote a small MATLAB function (found in the appendix) to tabulate how much of a weight contribution this is to the mission payload. The mission payload also includes the equipment for the reconnaissance mission. The methods are found in the appendix, but the called function appears as the following:
This is in line with the historical value of 266 kg for this mission’s crew and their life support.
A technical summary for the critical mission profile is listed below:
- Logistics:
- Manned
- Reusable
- Reconfigurable
- Adapted to two SpaceX launch vehicles
- Performance:
- Design Aerodynamic Speed: Mach 7 (Possibly Mach 12 – 15)
- Ability to sustain Mach 0 – 25
- Atmospheric Endurance: 30 – 45 min
- Operations:
- Aerodynamically Assisted Inclination Change
- Orbit Capable
- Orbital Endurance: 3 days
- Max Payload: 7000 kg
Specifically, for the hypersonic stage, the vehicle state upon staging with the launch team has been determined in the class script. This work domain is iterated upon in light of the deliverables from propulsion and performance. Increasing the performance demands on the hypersonic stage decreases those demands of the launch vehicle, and vice versa. It is imperative that the weight-critical mission converge on a good staging point along the combined vehicle’s trajectory.
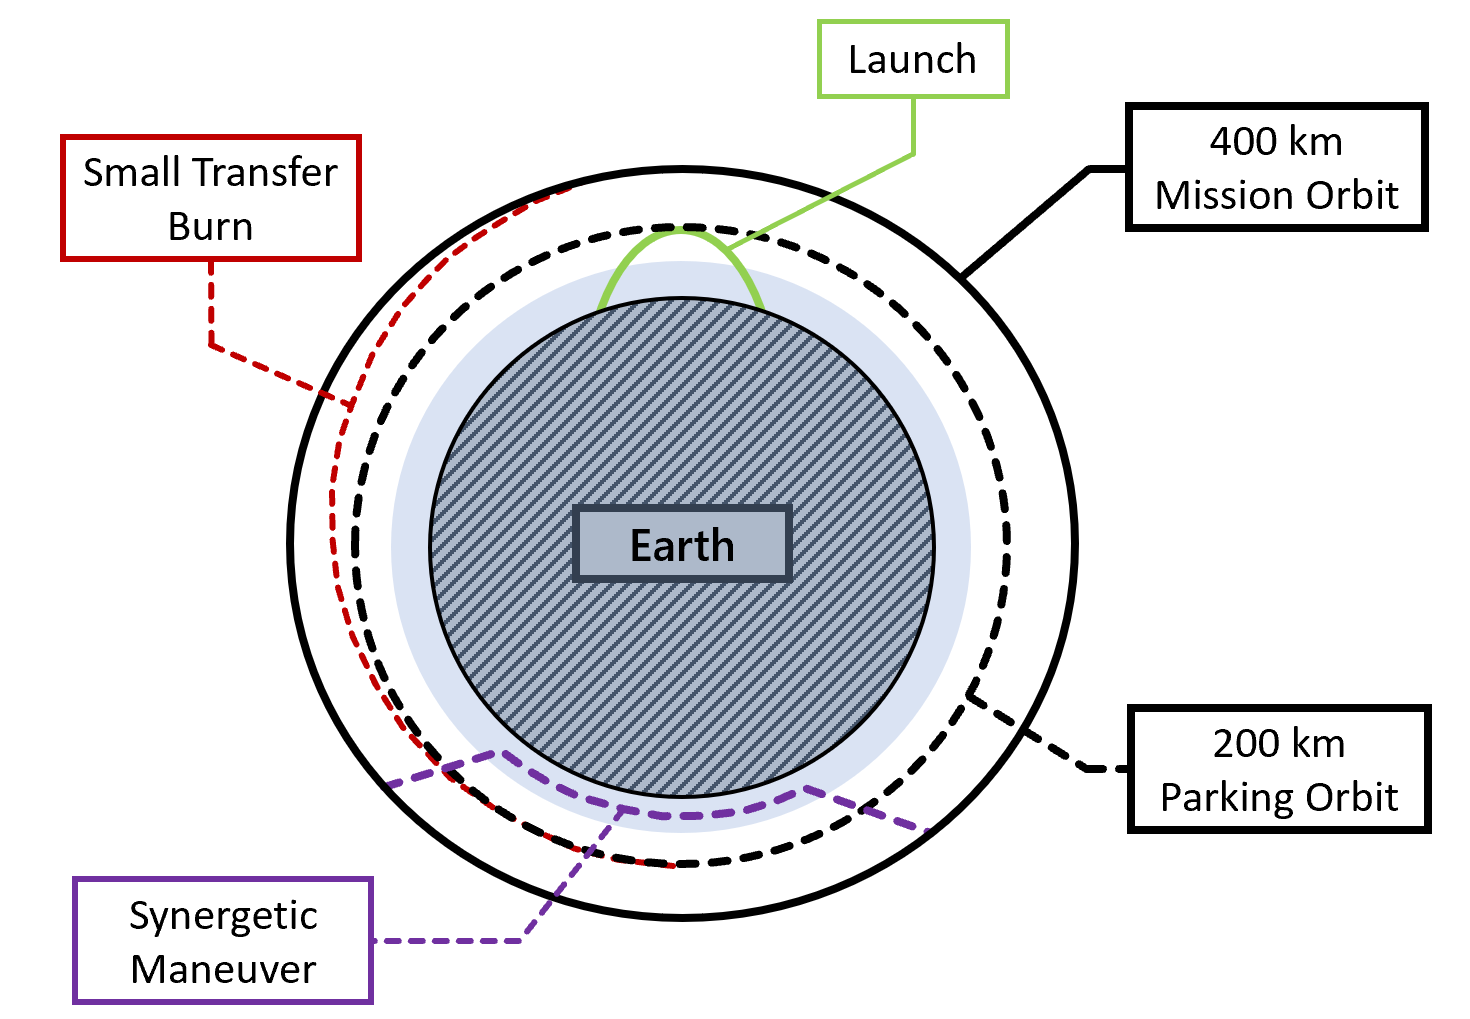
The general mission profile for the Reconnaissance variant is shown in Figure 42, including the transfer burn to a slower ground-track, higher altitude orbit to increase proficiency in Reconnaissance. After launch and during orbital operations, the spacecraft can perform its synergetic maneuver to change its inclination.
EMission Trade Studies
The mission trades begin with the launch site minimum inclination, which is the inclination which is most advantageous for visibility from the surface (therefore the stealthiest parking orbit) as well as velocity change required from the launch vehicle. However, this reduces the potential coverage by any incidence angle changes made by the hypersonic vehicle and increases performance demands. For example, a low-inclination starting orbit will be easier on the launch vehicle but will require two incidence angle turns (at the 30-degree requirement) to effect global reconnaissance coverage. This is advantageous if global coverage is required but will not cover the entirety of Russia. Moreover, covering such high latitudes is not expected to be significant given the low amounts of human activity at the poles. Even if the 2nd turn is unlikely to be initiated, a one-turn version of this mission can be utilized for China, Europe, and Southern Russia (covering most of the population centers as well as the main seaports).
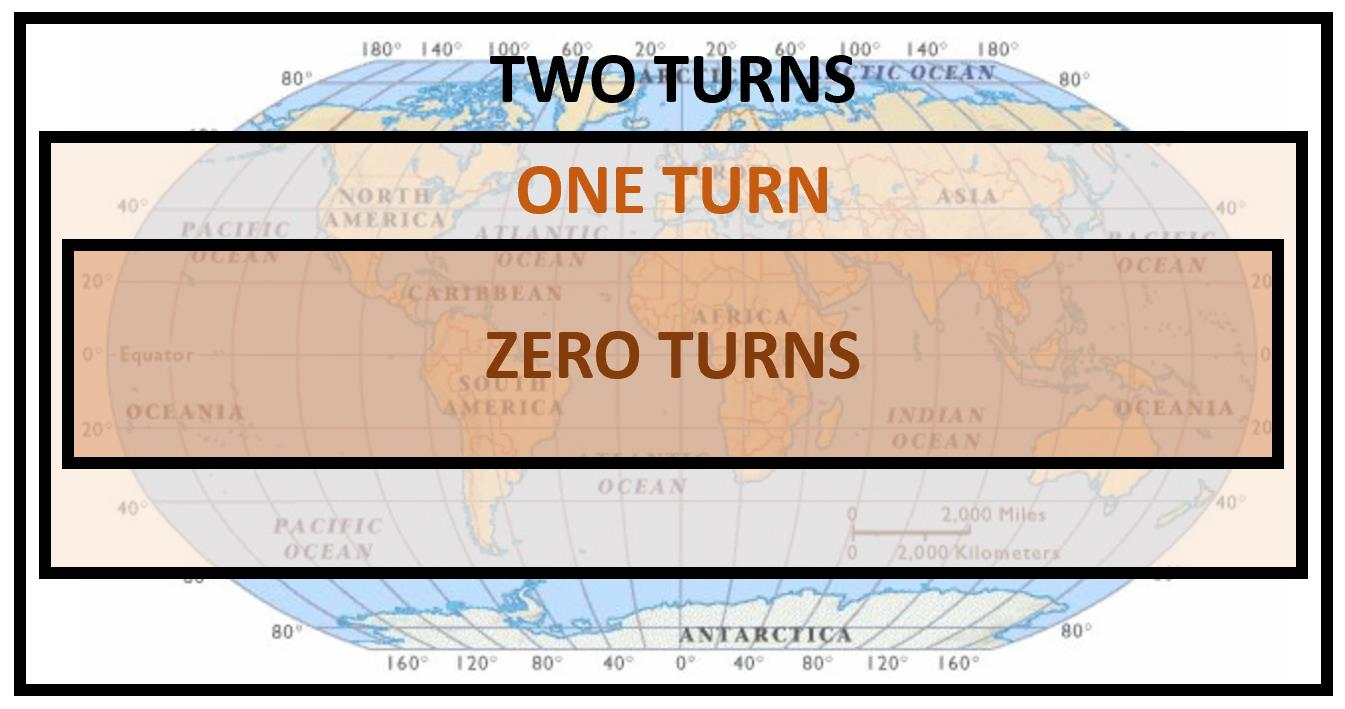
This mission type is useful for civilian transport, as launch costs can be reduced by going into an “easy” low-inclination orbit, then using a turn to arrive at a population center. This is using the cross-range capability of the vehicle to the fullest advantage.
Another possible mission requires one turn from a higher-inclination orbit to allow for full coverage of Russia. This is considered a critical mission for the team as it requires a vehicle aerodynamic turn and higher performance requirements from the launch vehicle.
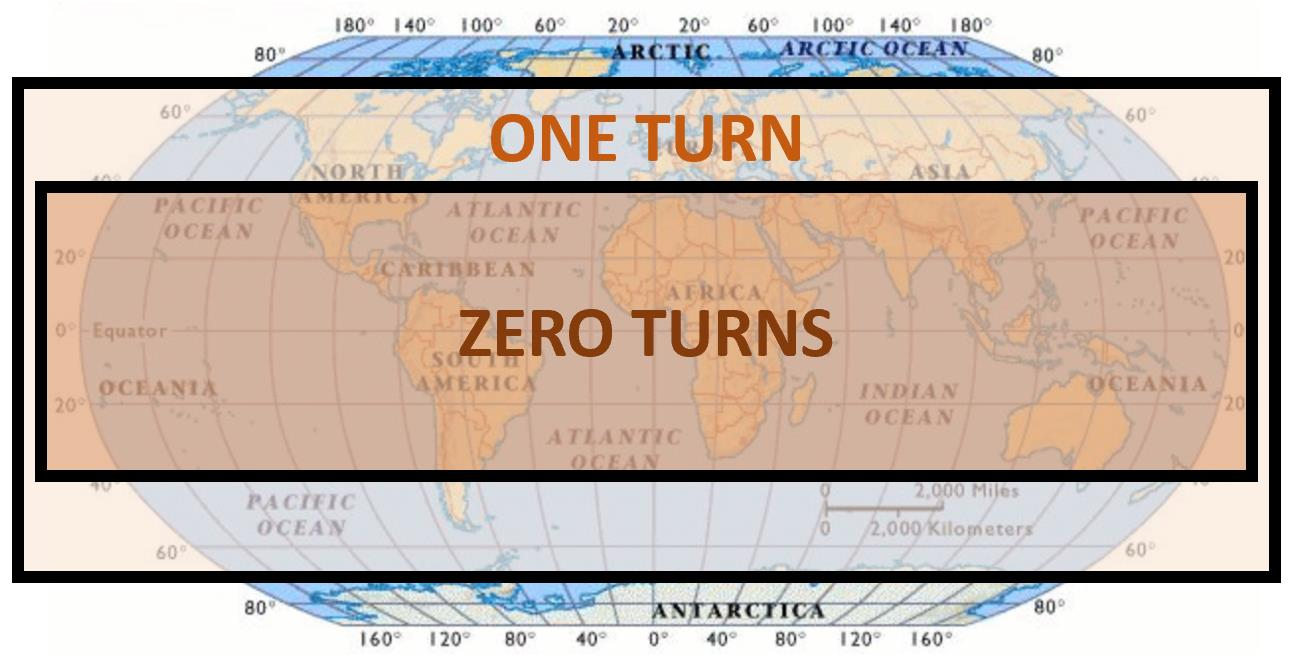
The next mission type requires zero aerodynamic turns (therefore a much lighter hypersonic vehicle weight), but it has a high inclination at launch (therefore the highest delta V requirement for the launch vehicle). This mission is intended to dock with the international space station (inclination of 51.6 degrees), where no surprise orbital changes are required. The crewed vehicle can then use its cross-range capability to quickly land anywhere on the globe with a sufficient runway.
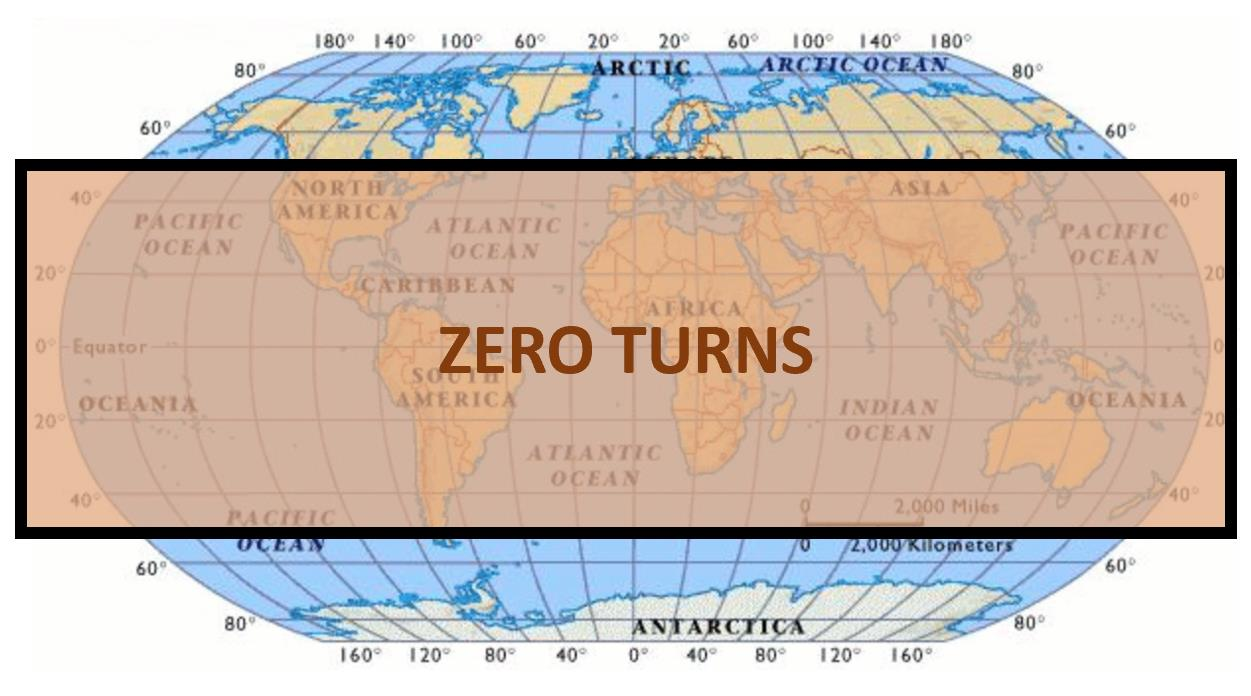
A lunar fly-by was considered for the tourism market, which pays about 175 million USD per ticket according to what competitors are selling [32]. While the delta V requirements were found to be sufficient for a free-return trajectory, this mission is determined to be unfeasible due to the re-entry velocity. There is not enough fuel to slow down the return vehicle by means of propellant before using the atmosphere to destructively slow down the space craft. A thermal protection system to combat this type of loading will be too heavy to carry on a lunar mission, and reduce delta V. The margins for delta V required for a lunar fly-by are just too low.
The Model 176’s mission performance can be assessed for different planets. In conjunction with the senior project, the author has developed a script that is able to conduct performance analysis in different planetary environments and different aerodynamic capabilities [33], and finds it appropriate for a mission trade study. Additionally, this analysis serves to provide numerical evidence for the advantages of a synergetic maneuver over a propulsive one. Essentially, this is a more detailed look into Figure 2 by using Nyland’s analysis from reference [28].
To consider the nominal mission for the reconnaissance variant, the following process is implemented as outlined in Figure 46:
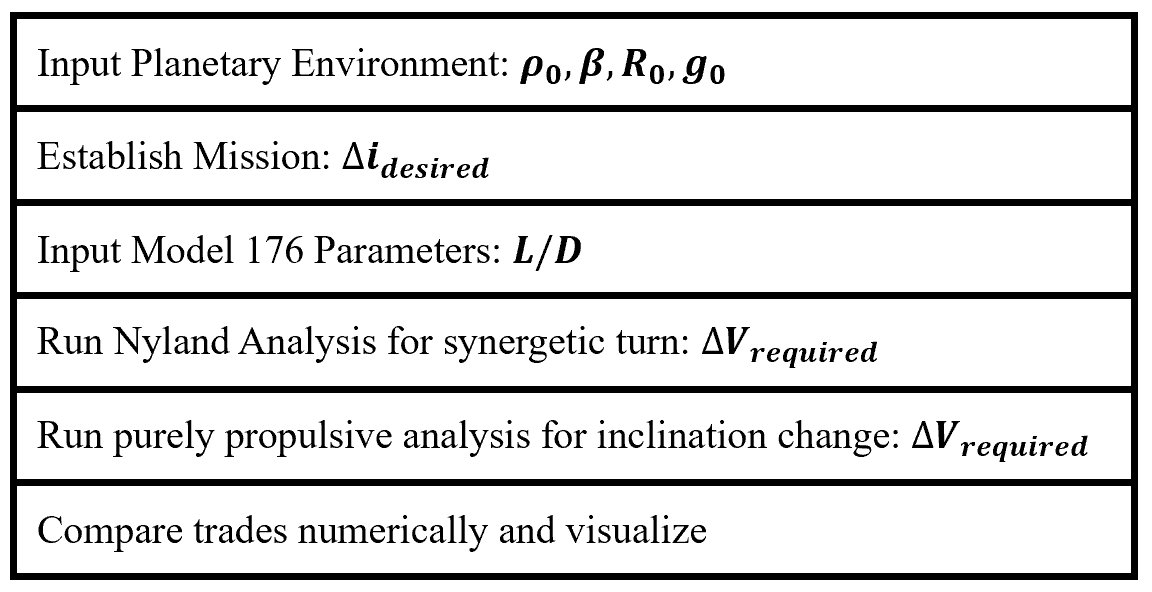
Figure 2 is replicated here according to the analysis shown in Figure 46, where the lift to drag ratio is 3.
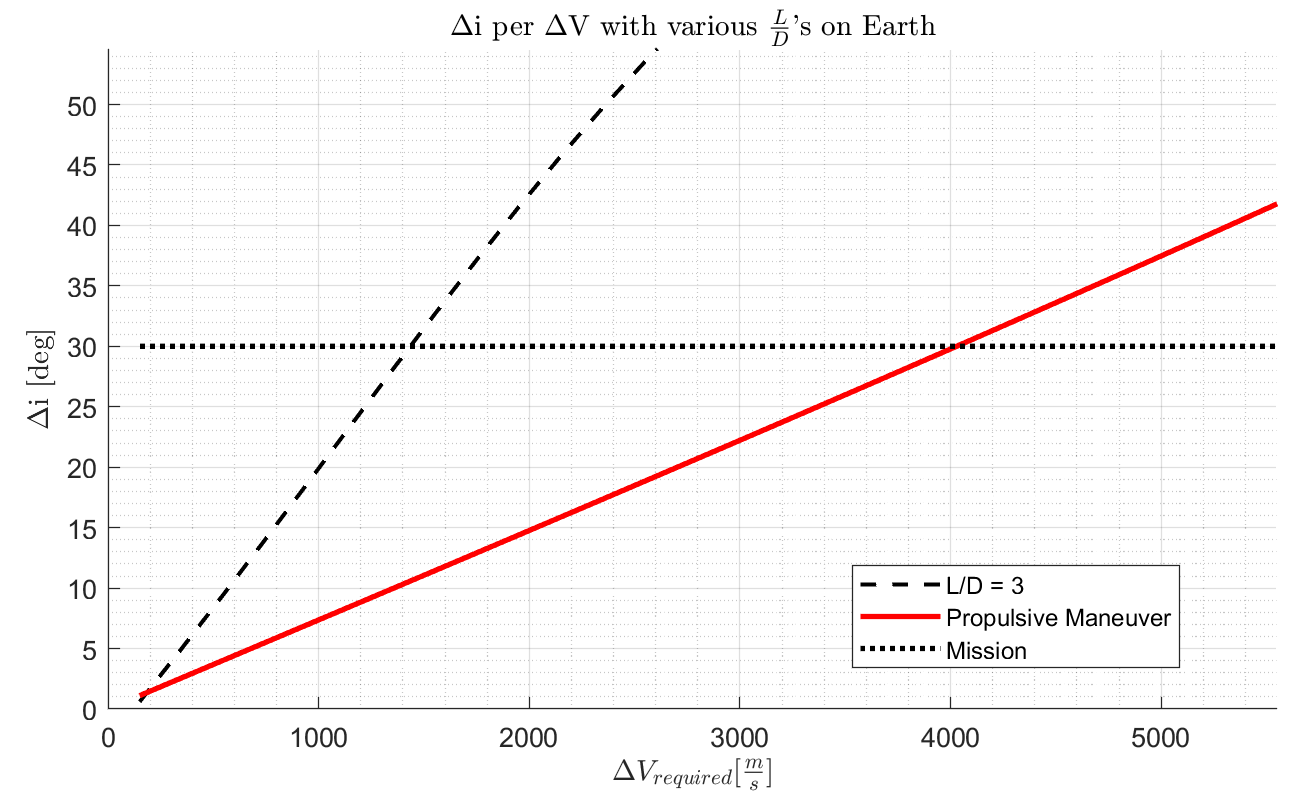
Clearly, the aircraft can save a tremendous amount of fuel (about 2.6 km/s of delta V) to achieve the same mission requirement of a 30-degree inclination change. However, at the lowest inclination change requirements, it may be advantageous to simply use propulsive means to achieve the inclination change. This crossover point is visible in Figure 47 at around 1 degree of inclination change. This makes sense, as the reader will find it a waste of effort to have the craft’s profile enter the atmosphere for a minor inclination change like docking with a space station. However, this is only the case for very small inclination changes as changing the large orbital velocity vector is expensive in terms of fuel costs.
The next question the author wanted to look into was how dependent the mission profile choice was on the aerodynamic capability of the aircraft. This is more of a sensitivity analysis to see how the aerodynamic capability “buys its weight” on this craft. Different lift-to-drag requirements are tested, as shown in Figure 48, to see much of a fuel cost is incurred by lowering the aerodynamic capability.
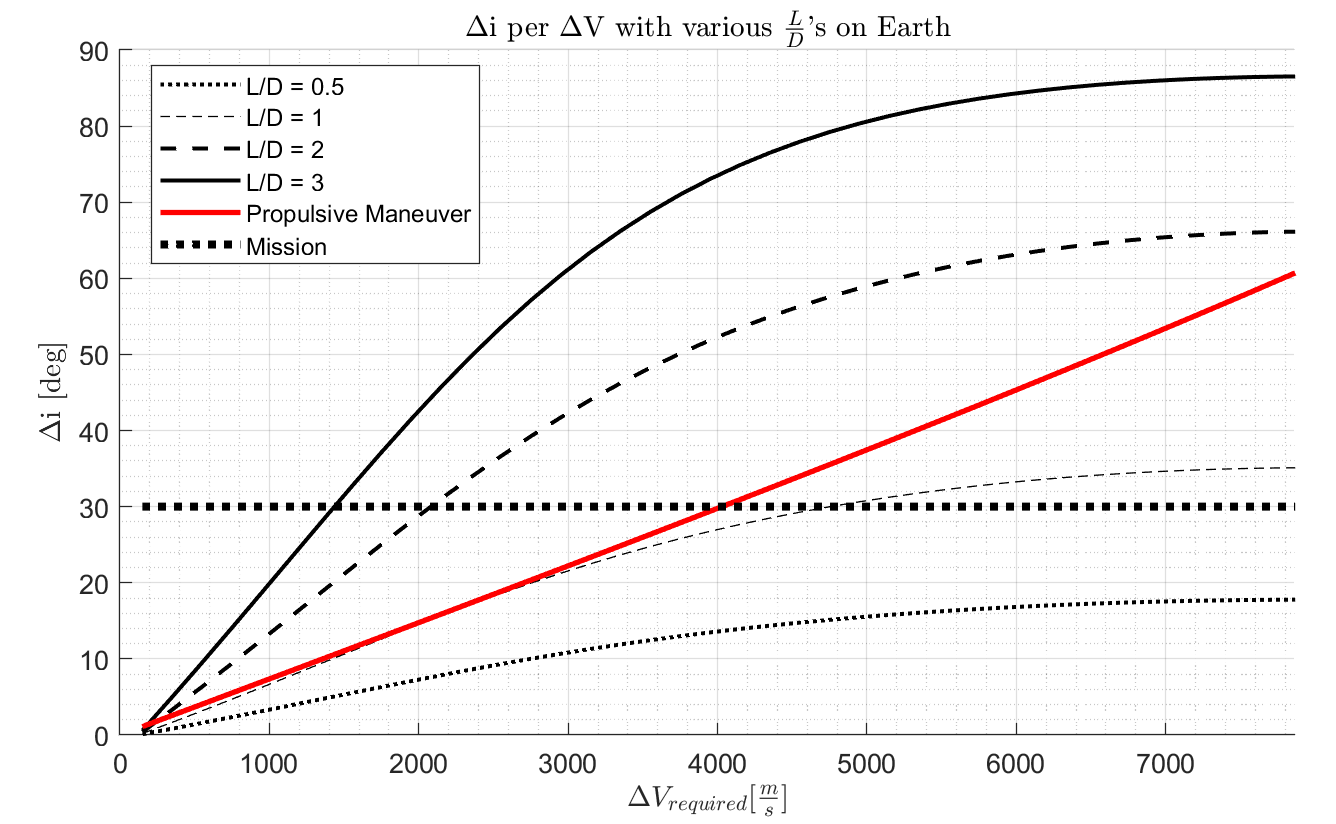
This is one of the most interesting analyses in this report, as it demonstrates the advantages gained by increasing aerodynamic performance of the spacecraft. It seems as though a synergetic maneuver with an associated average lift-to-drag ratio of 1 is the lowest which can substitute a propulsive inclination change at around 16 degrees. However, is not suitable for the mission. Additionally, lower lift-to-drag ratios are not capable of completing the mission without completely re-entering the atmosphere. It is almost certainly not desired to enter the atmosphere with the intention of changing orbital inclination with such low aerodynamic performance.
The lower inclination changes are more closely examined in Figure 49 to determine the decision cross-over point between various aerodynamically performing aircraft and the conventional propulsive maneuver.
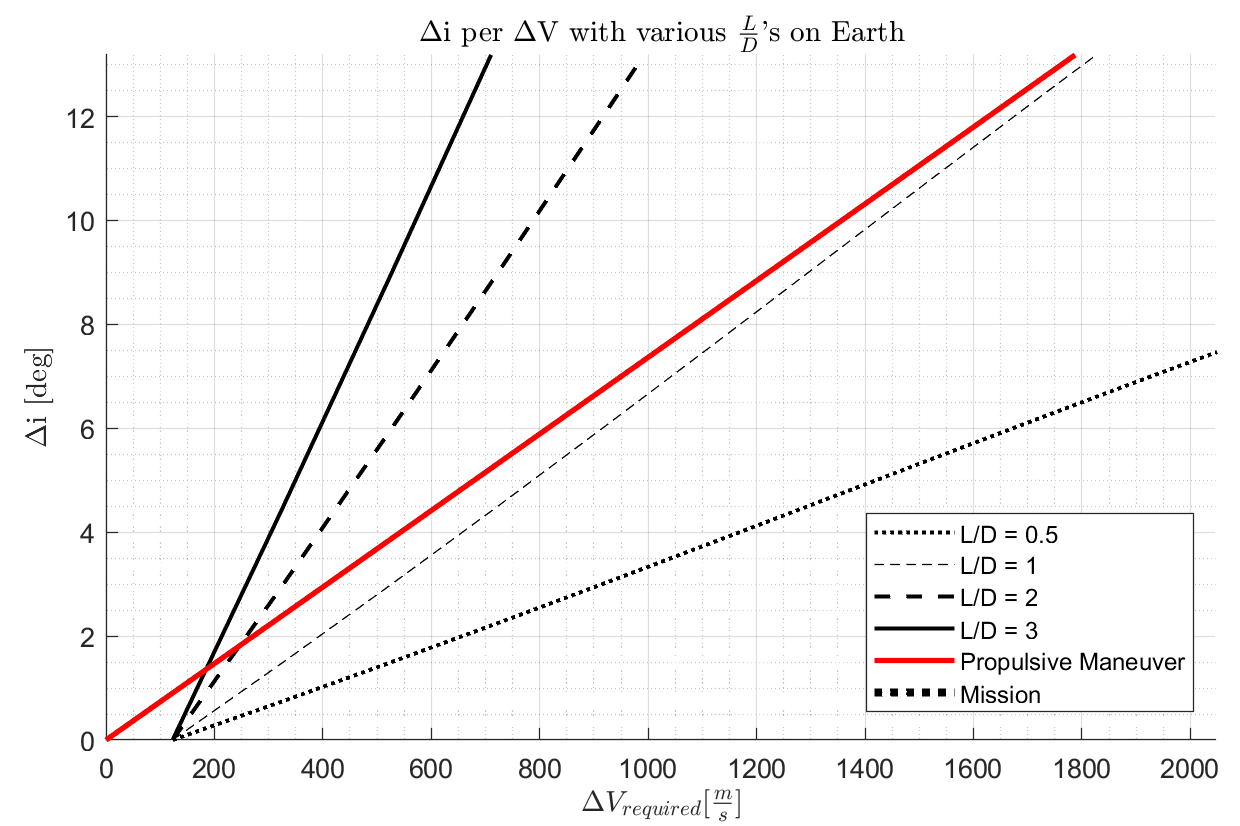
The crossover point (if there is one) is increasing as the aerodynamic capability drops. This makes sense, as the lower performing vehicles conduct an aerodynamic maneuver with higher delta V costs. It is interesting to see that the shape of this plot resembles the author’s reasoning as shown in Figure 2.
Lastly, the author wanted to change the planetary environment in which the Model 176 performed to see how much the performance of the aircraft was dependent on the atmospheric environment and its respective gravitational constant. Considering that even on Earth these parameters fluctuate across different seasons and latitudes, it was deemed a relevant trade study for the scope of this project.
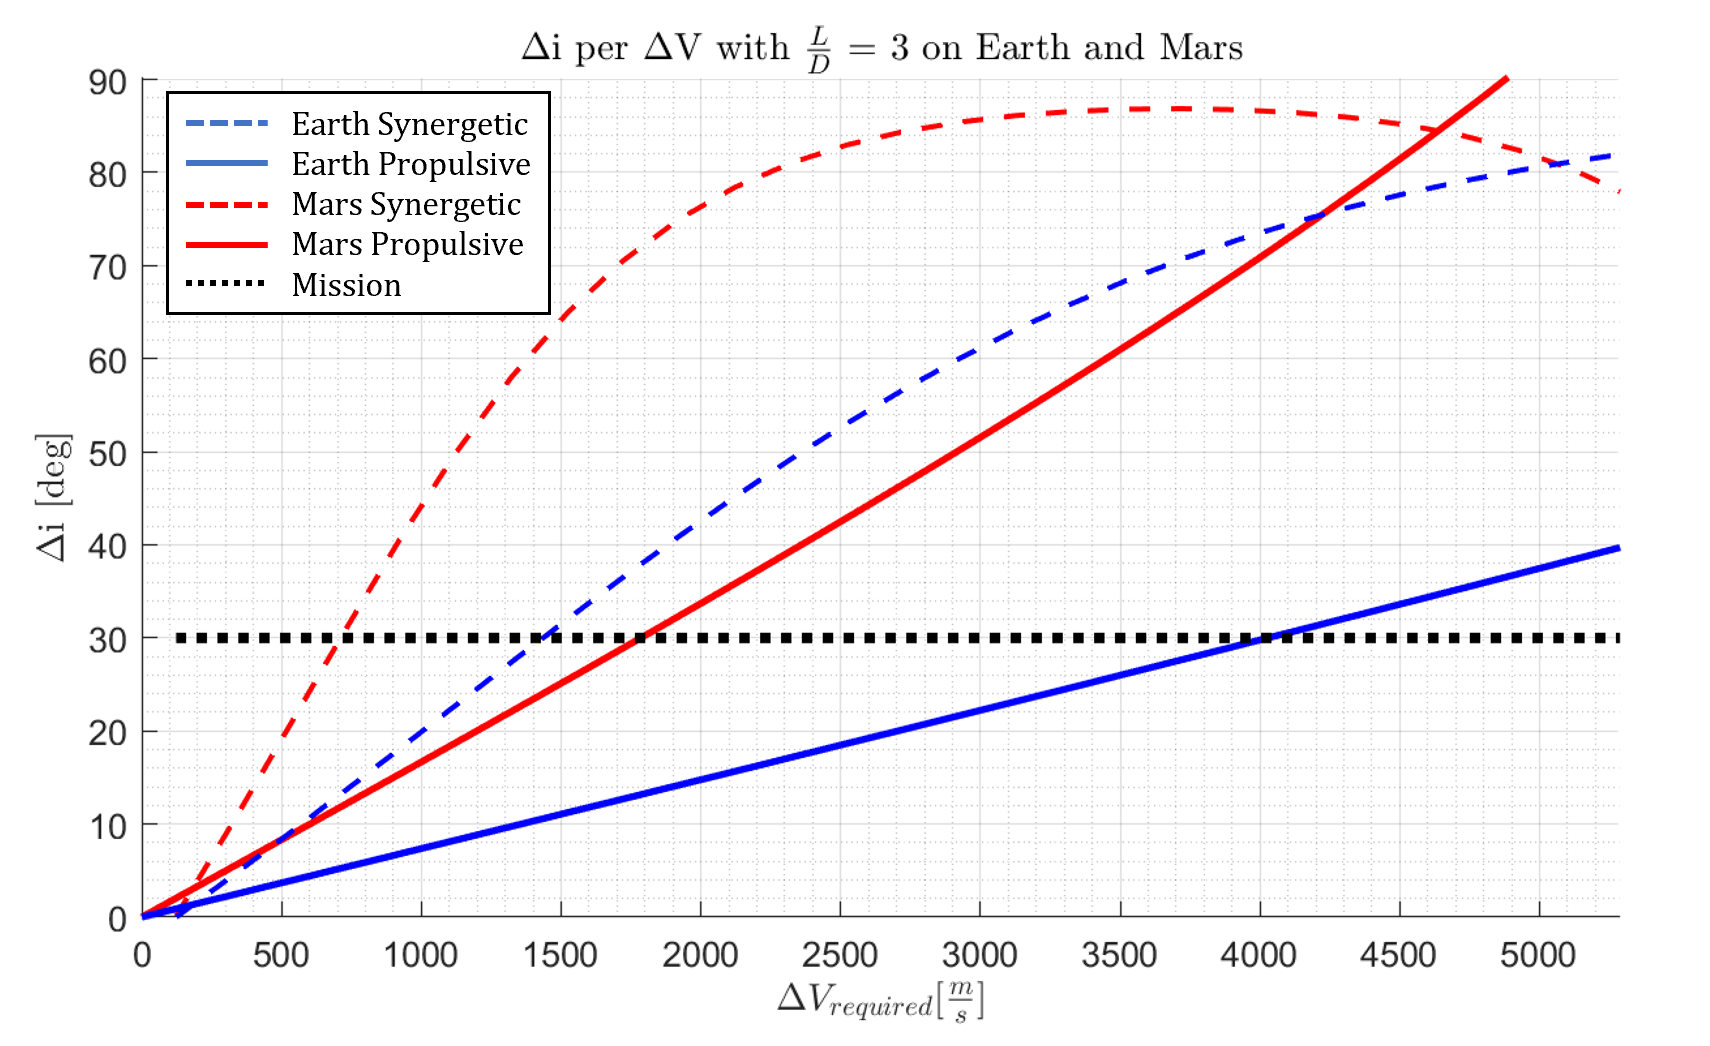
The relationship between synergetic and propulsion remains the same, but scaled to different fuel requirements for different gravitational fields. This is not scaled linearly, as different atmospheric scales require different burns to initiate a turn. For example, the turn for Earth is initiated at 67 km above the surface, and the turn for Mars is initiated at 34 km above the surface due to its thinner atmosphere. It is interesting to see that the crossover points between the two mission profiles for each planet scale as a function of the required orbital velocity for a 200 km orbit. This makes sense, as orbiting something like an asteroid would take minimal delta V to change the direction of the orbit since the angular momentum required to maintain an orbit is so low.
Spotted an error, or want to reply? Email me: leonardo.pinero42 [at] gmail [dot] com